Introduction
The Danish pensions dashboard, PensionsInfo.dk, is run by a team based in Hellerup, just north of Copenhagen, headed by Michael Rasch.
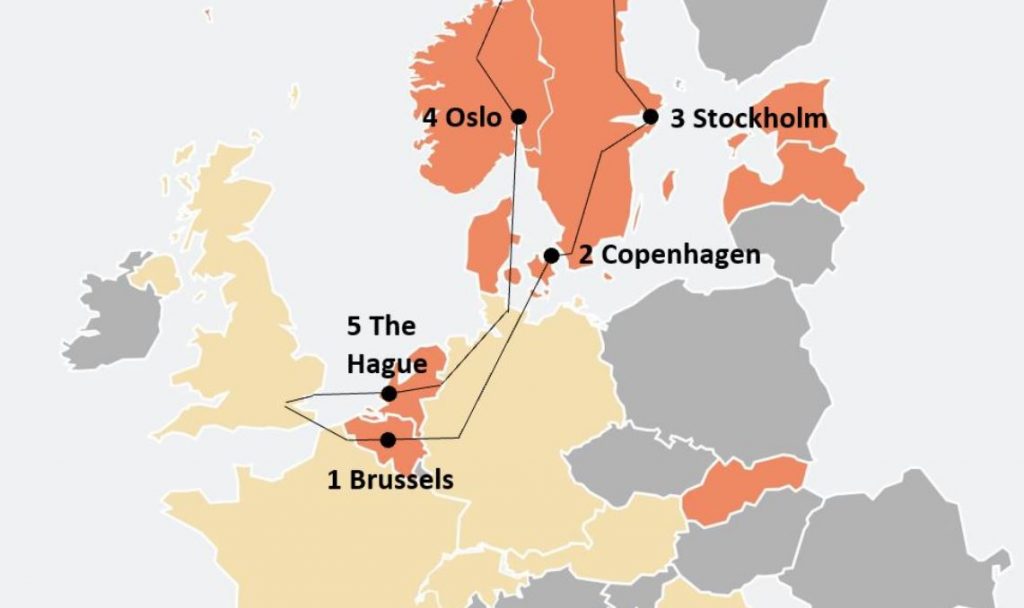
On 14 June 2023, I had the absolute privilege of visiting Michael on the second stop of my Pensions REDUX tour.
The core purpose of the tour was to learn more about mature pensions dashboards’ user experiences (UXs) and user interfaces (UIs).
So the main findings below focus on the high-level UX and UI before, whilst, and after using PensionsInfo.
Michael was also very generous providing me with other insights, such as usage statistics, so I’ve included some of these findings below too.
Before reading on, for context please do have a look at the Background and 10 General Comments page.
After reading the findings below, feel free to get in touch with me if you’d like to talk about dashboards, discuss the findings, and what they might mean for forthcoming pensions dashboards in the UK.
What’s on this page?
Other information about PensionsInfo
UX before using PensionsInfo
PensionsInfo is an online service well-known to Danes.
A little anecdote: The night before meeting Michael, I stayed at a hotel near Copenhagen. In the morning, after I answered the hotel receptionist’s question about where I was heading, she said: “Oh, we’re so lucky to have PensionsInfo here in Denmark – it’s amazing!”.
A sample set of just one, I know, but pretty impressive nevertheless!
PensionsInfo is a pensions industry association service, with participating firms promoting the service to their customers. Often, Danes first hear about PensionsInfo when they get a loan or mortgage and are required to send the lending firm their pensions information.
Users can log in to PensionsInfo.dk either direct or via open banking (which is mainly desktop rather than open banking apps). Arriving at the service, users can choose whether to see it in either Danish or English:
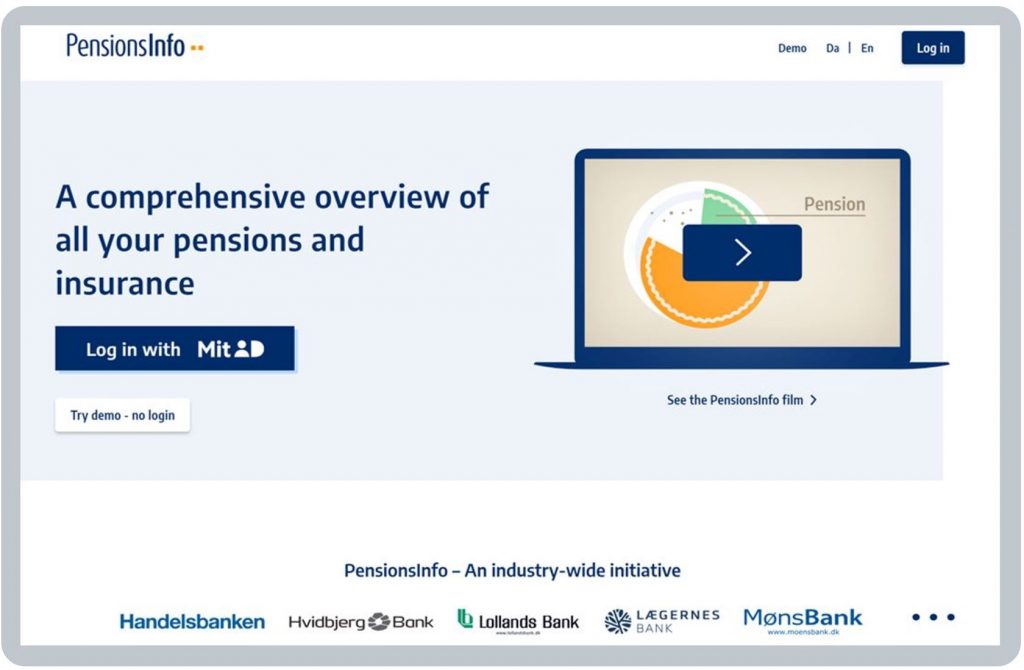
At least five elements, right at the top of the homepage, help start building confidence and understanding:
- the service is described as comprehensive, so users know it shows their total pension picture
- it is described as an overview, setting users’ expectations that this is just a summary
- a short explanatory video about the service, with some great animated graphics
- a demonstration system so a new user can experience what they’ll see without having to log in
- a carousel of logos of all participating pension providers, helping to set users’ expectations about who is involved, which in turn starts to build trust immediately.
Can you begin to see why, in my LinkedIn post after I met Michael, I suggested PensionsInfo might in fact be the “King of pensions dashboards”? Really clear; really simple; building trust immediately.
What else can you see before logging in?
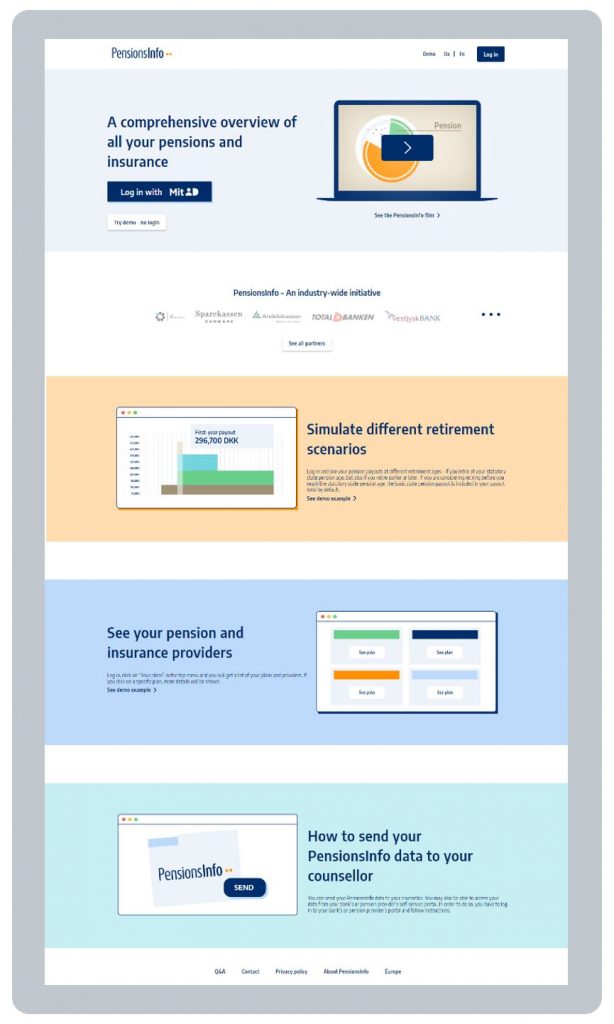
The remainder of the homepage also explains how users can:
- simulate different retirement scenarios, e.g. retiring at different ages
- securely send pensions information to their financial adviser (counsellor)
- see life insurance death benefits alongside their retirement pensions information.
BLANK
The homepage invites the user to log in using MitID, which is Denmark’s national digital ID service:
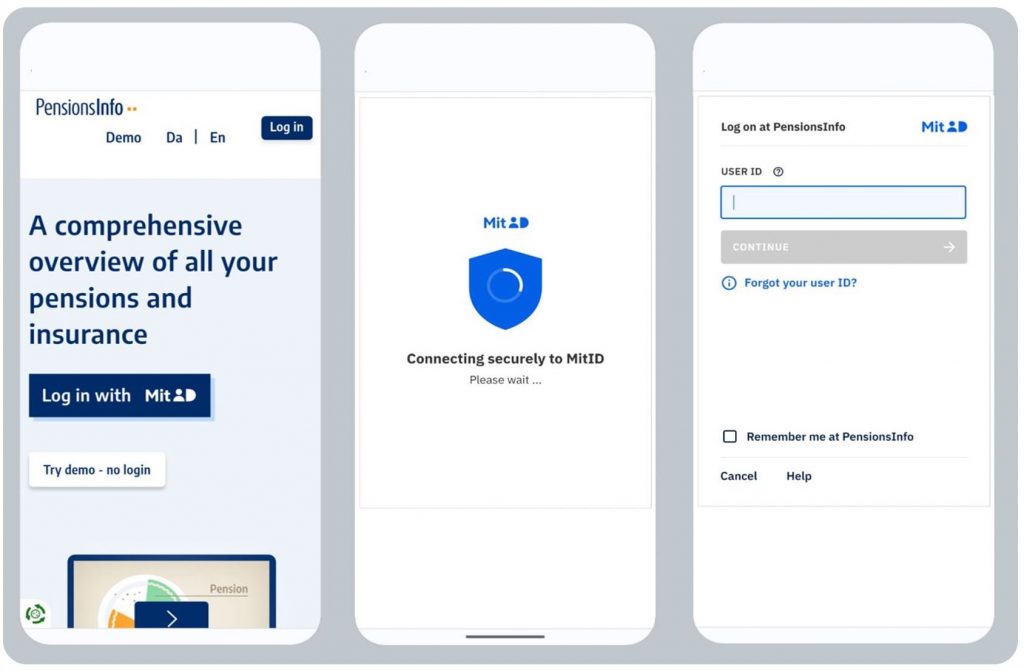
As explained in General Comment 5, there’s not much point covering Denmark’s national digital identity service in any detail here – it is what it is, and the UK’s identity service will be what it will be, i.e. there are no design choices to be made here by UK dashboard operators as they will all be required to use the same central identity service.
Matching Danes to their pensions
A couple of hours after birth, every Danish child is allocated a National Identity Number (NIN). Throughout their life, every Government department, bank, pension provider, etc. uses this Number to identify them.
PensionsInfo uses NIN when Danes log in to the dashboard. PensionsInfo holds a record of which NINs (i.e. Danish people) have pensions with which pension schemes and providers. Pension providers update this central store daily. So when a user logs in, PensionsInfo can immediately, and safely, send requests for up-to-date pension data to the user’s specific pension schemes / providers making use of this unique NIN.
“Finding” pensions digitally in Denmark has not therefore been the challenge it will be in the UK where, in addition to National Insurance Number (NINO), data providers are going to compare against other personal data items such as Last Name and Date of Birth (see General Comment 6 for more details on this).
BLANK
UX whilst using PensionsInfo
After the user has logged in to PensionsInfo, this is the landing (or welcome) page as it appears on mobile, and then as it appears on desktop browser (see General Comment 4 on different device optimisation):
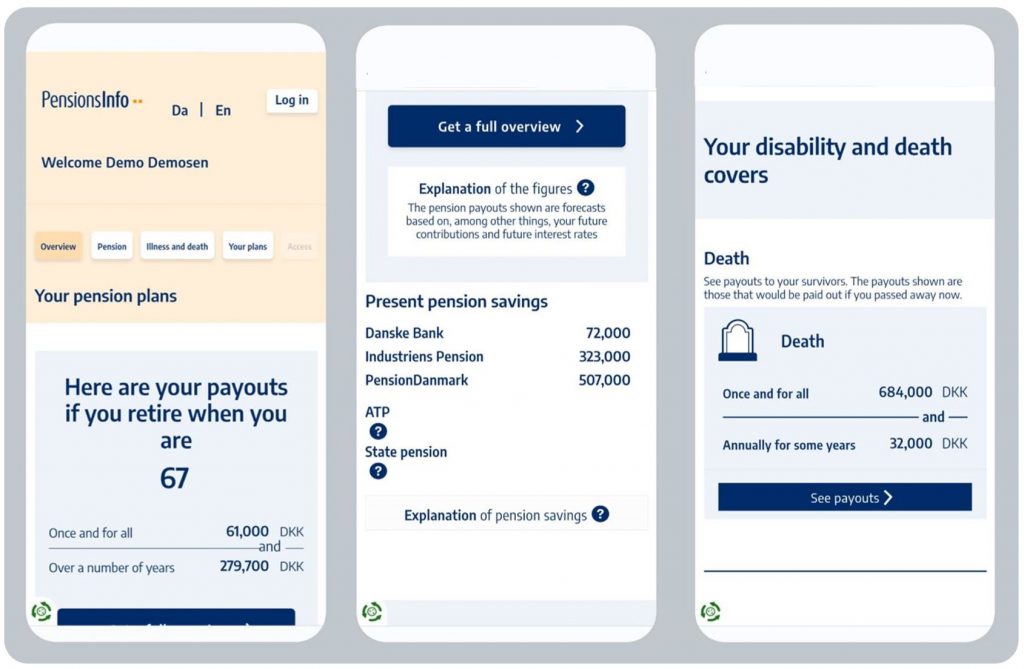
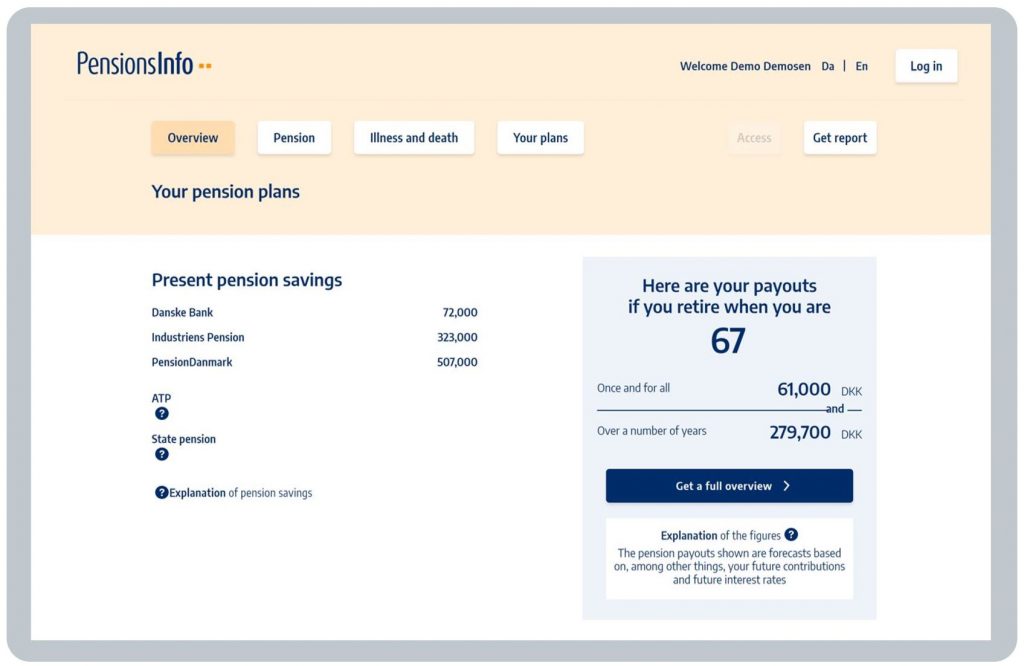
As you can see, the landing page is very clear and simply laid out, showing:
- total annual* pension income if the user retires at 67 and one-off lump sum (“once and for all”) (* Michael said users might find monthly income helpful too)
(in this example, the pension is 279,700 DKK a year and the lump sum is 61,000 DKK; on current exchange rates, that’s c.£32,400 a year and a c.£7,000 one off lump sum)
- full overview button for those users who are interested in seeing more details
BLANK - explanation of forecasts info button, including that forecasts are not binding
BLANK - current fund values (“Present pension savings”) for those pensions which are defined contribution (DC), with info buttons for those pensions which are defined benefit (DB) (e.g. ATP & State pension) explaining why no amounts are shown
BLANK - death and disability benefits, but I won’t cover these here as they’re not so relevant for the UK (being out of scope for initial UK dashboards).
BLANK
Full overview
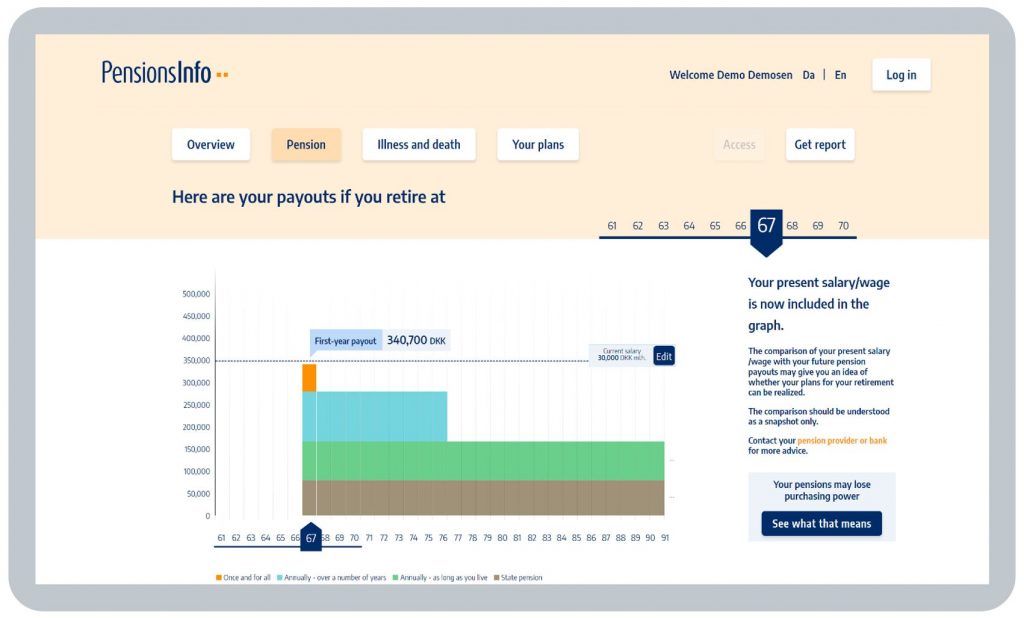
Clicking “Get a full overview” the user sees this page:
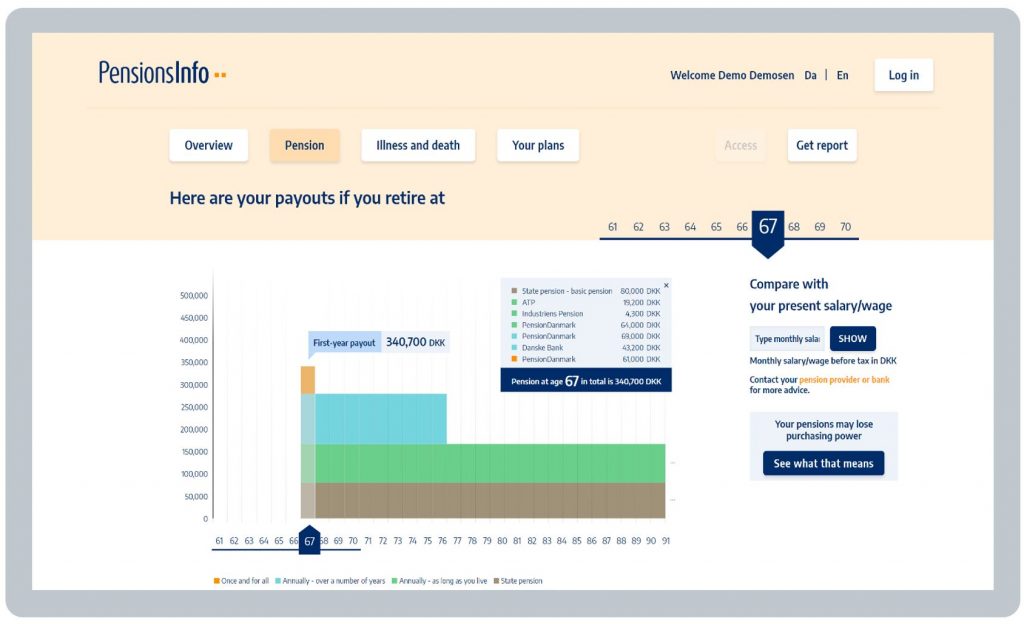
Again, this is a very clear and simple layout showing:
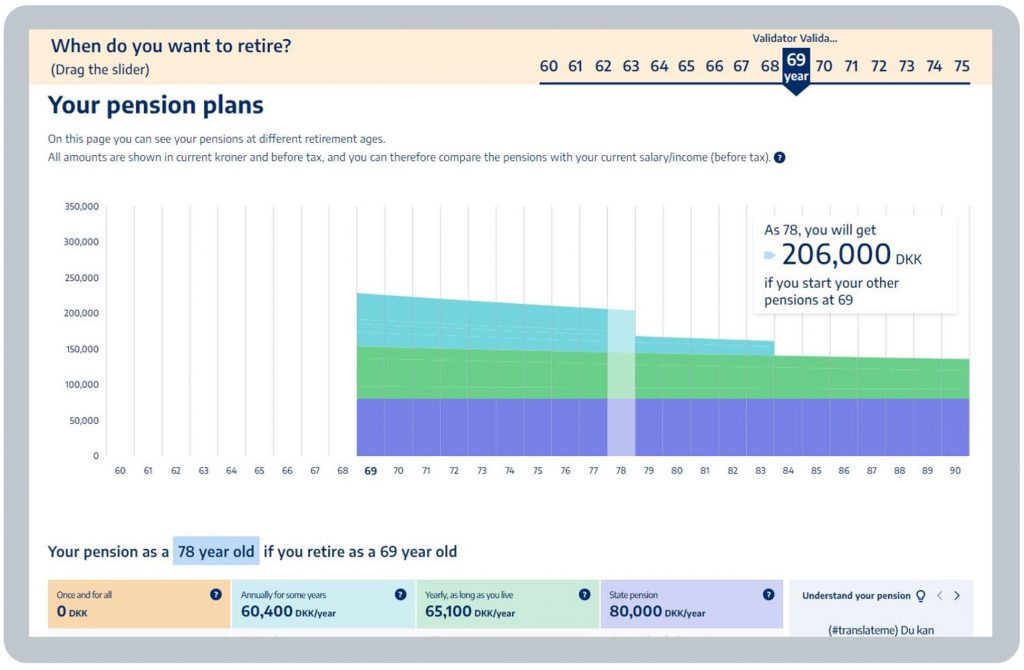
- a retirement timeline from the user’s 60s through to their 90s, helping the user understand immediately that their retirement could last quite a long time
BLANK - first-year payout (in this example, the first-year payout (at age 67) is the annual pension of 279,700 DKK, plus the one-off lump sum of 61,000 DKK, making a total first-year payout of 340,700 DKK)
BLANK - colour-coded pension incomes differentiating between one-off lump sums (orange), fixed term pension incomes (blue), pension incomes payable until death (green), and the State pension (brown) (with a pop-up box giving a further breakdown of each named pension when the user clicks each age)
BLANK - option to input current gross salary / wages as a comparator to what the pension income might be (see more on this below)
BLANK - alternative retirement forecasts if the user slides the retirement age arrow to younger or older ages (see more on this below)
BLANK - instruction to contact your pension provider or bank for advice (the “Your plans” button shows contact details for all of the user’s pension providers)
BLANK - explanation of purchasing power loss over time info button (see more below on how this is being further enhanced soon).
BLANK
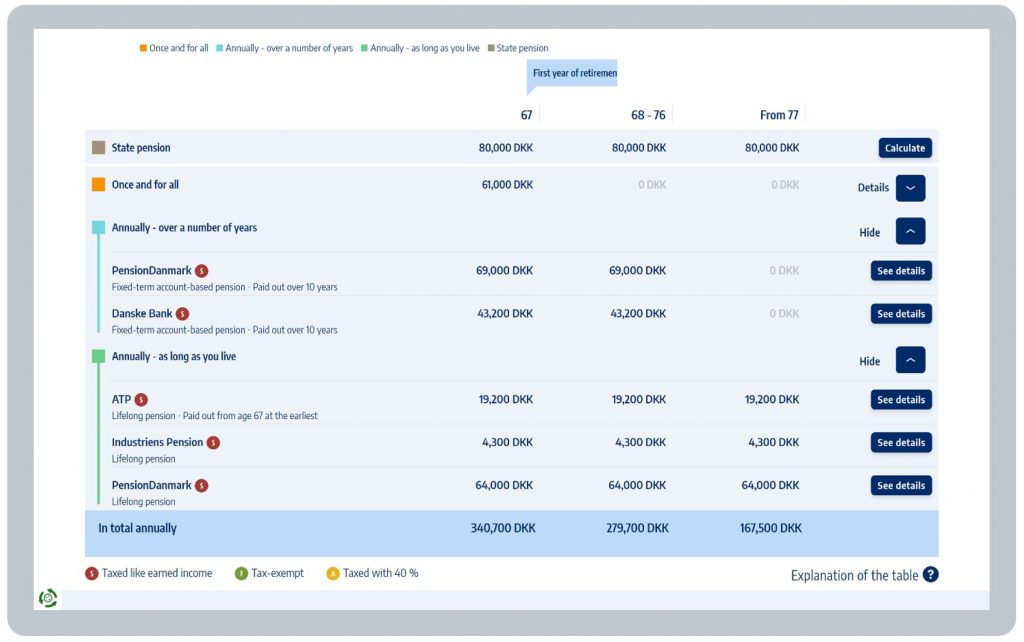
Table of pensions
Directly beneath the retirement timeline, on the full overview screen, the same information is presented in a clear table, with expandable breakdowns of the different colour-coded pensions. There is an info button to click for an explanation of the table, plus the table shows flags indicating which pensions are taxable or tax-exempt:
Enough? – income adequacy
To give users an idea if their total pension income might be enough to live on during retirement, there’s an option for them to input their current gross monthly salary or wages – I input 30,000 DKK. PensionsInfo annualises the monthly input and displays a comparison line on the graph (360,000 DKK a year in my example). A clear warning points out that “The comparison should be understood as a snapshot only”:
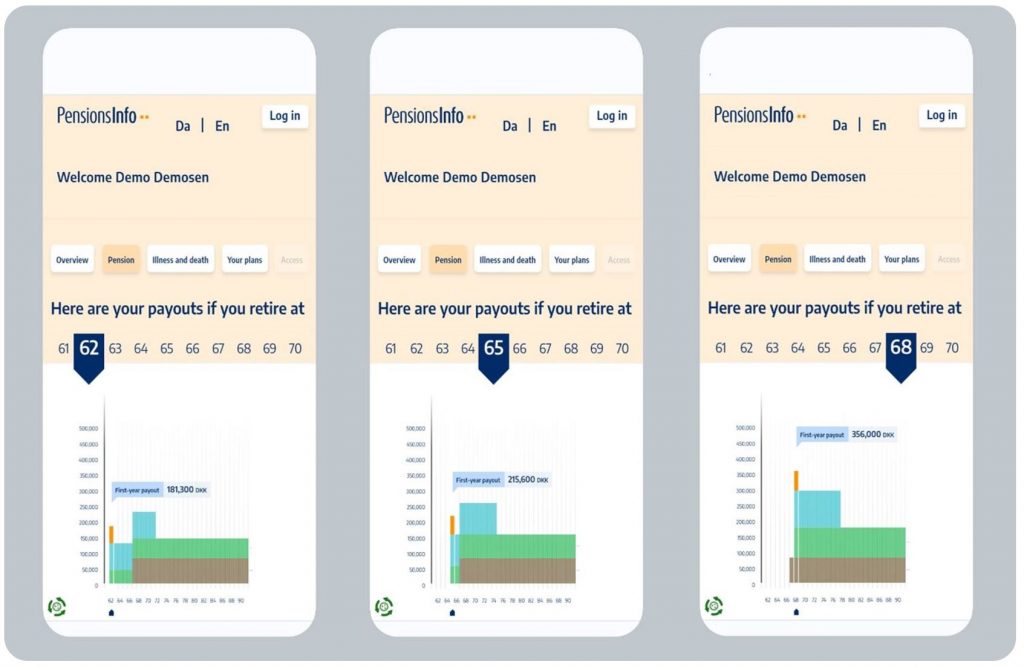
Alternatives? – different forecasts
The user can slide the retirement age arrow to different ages for alternative forecasts. Each provider sends multiple forecasts to PensionsInfo (i.e. to age 61, 62, etc. up to 70), which PensionsInfo then totals up at the different ages across the user’s different pensions:
BLANK
UX after using PensionsInfo
Many users’ core interest in their overall pension position can be boiled down to three simple questions:
- What have I got?
- Is it enough for me to live on in retirement?
- What can I do?
What have I got?
In Denmark, the initial focus of PensionsInfo is to help Danes answer question 1, in terms of both:
- a total forecast pension income at different potential retirement ages, and
- current defined contribution (DC) retirement savings funds.
PensionsInfo also allows users to download their pension information for future reference if they wish.
In addition, users can securely send their pension information to a third party, such as a pensions provider – users often do this whilst accessing PensionsInfo.dk on their phones as they’re not actually looking at the information themselves, they’re just sending it on to the third party.
Both of these two “after” services (i.e. Get your pdf report and Send data to a third party) are used over a million times every year.
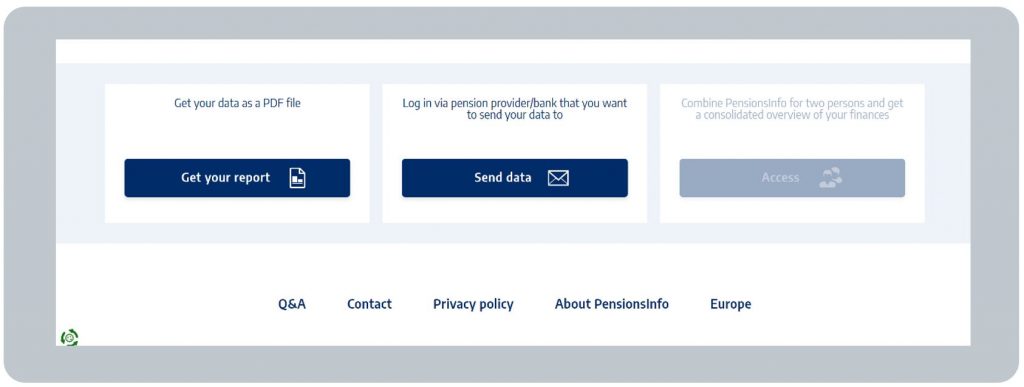
Downloads are also used as part of the evidence financial institutions require for other financial products, e.g. mortgage applications, so this is a major motivation for younger people to use PensionsInfo.
Is it enough?
In terms of the second question above (“Is it enough?”), users often feedback they would like to know what pension income they should be aiming for: in fact this is the most requested new feature. But PensionsInfo doesn’t offer this information as it is a neutral, impartial service, and every consumer is different.
What a user can do is Send data to their provider(s) or adviser and then talk to them about what “enough” pension income might be for them in the context of their specific circumstances.
Also, one thing users can do is input their current salary / wages to give an idea how their forecast pension income might compare to what they earn today.
Users also say they would like to see how their forecast total pension income compares to other people like them, but again the PensionsInfo team has decided not to offer this because everyone is different.
Household pension income
Thinking about adequacy of pension income more broadly, at the “household-level”, one thing which is truly impressive is PensionsInfo’s ability to show two spouses’ or partners’ pensions together.
When I visited Denmark, Michael logged in himself, to show me PensionsInfo displaying his own pensions. Then, he was able to send a secure message to his wife, who granted temporary permission for her pensions to be shown alongside Michael’s, i.e. giving a total household pension picture.
This is a truly aspirational dashboards feature for the UK – remember PensionsInfo is 25 years old in 2024!
What can I do?
On the third question above (“What can I do?”), PensionsInfo is focused on being impartial, so it lets users address this more subjective question themselves afterwards.
For example, after using PensionsInfo, Danish citizens may take steps to:
- understand in more detail what pension income they may need in retirement
- learn more about pensions generally to give wider context
- speak with their pension providers, or an adviser, or others who can help
- take appropriate steps to improve their pension position if they wish to do so.
BLANK
Taking action
As discussed in General Comment 7, the extent to which users actually make changes to their pension position after using PensionsInfo.dk is not explicitly visible to the PensionsInfo.dk team. This is because PensionsInfo deliberately focuses on offering an impartial “Find and View” service which primarily seeks to empower consumers, helping them to be better informed, so they are able to make better decisions.
BLANK
Usage of PensionsInfo
The number of user logons each year to PensionsInfo.dk has increased steadily to just over 5 million, increasing quite consistently by roughly a third of a million every year since about 2006/07: 2007 was when it first became possible for users to log in through open banking, when the participating data providers hit critical mass, and when the “Send data” feature mentioned above became available.
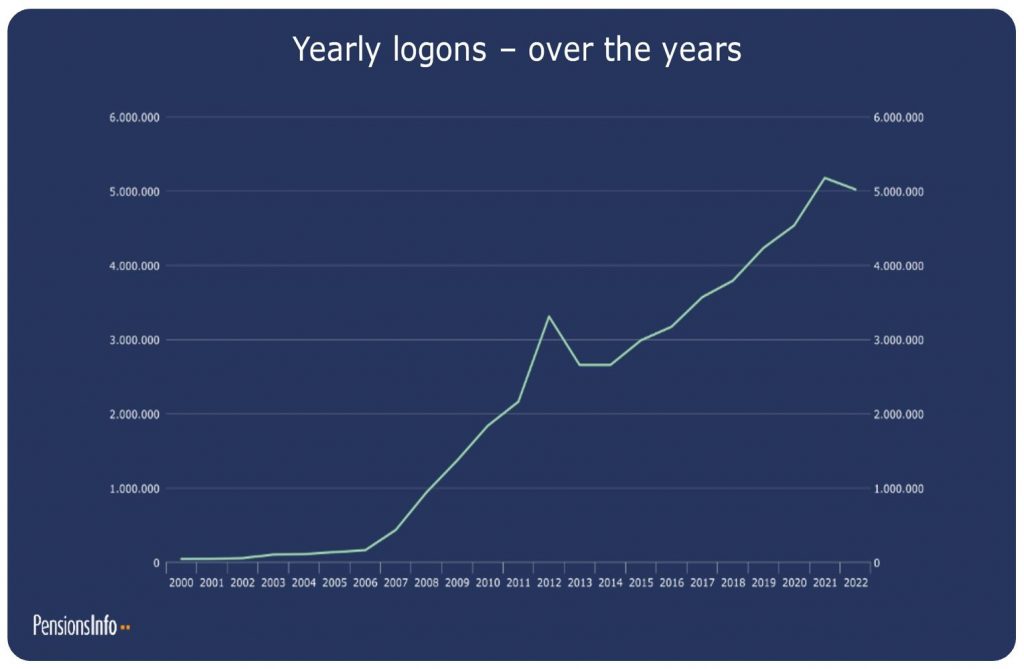
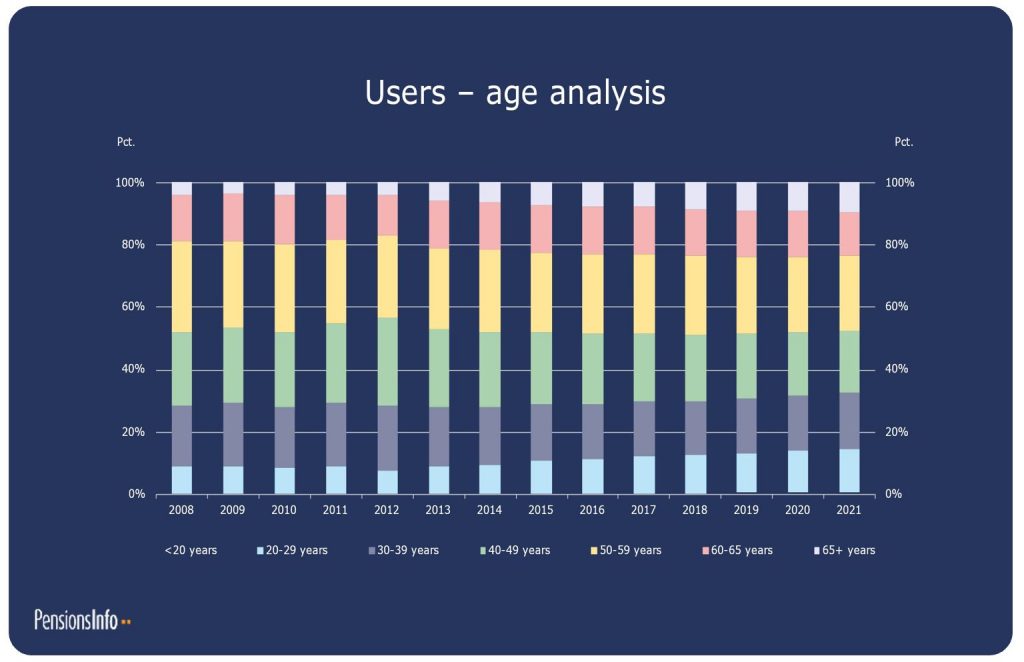
About 60% of users are aged 40-65 (green, yellow and red in the chart below), but this proportion has been gradually reducing over the last 15 years as more 20-somethings and more over 65s become PensionsInfo users:
Who is logging on?
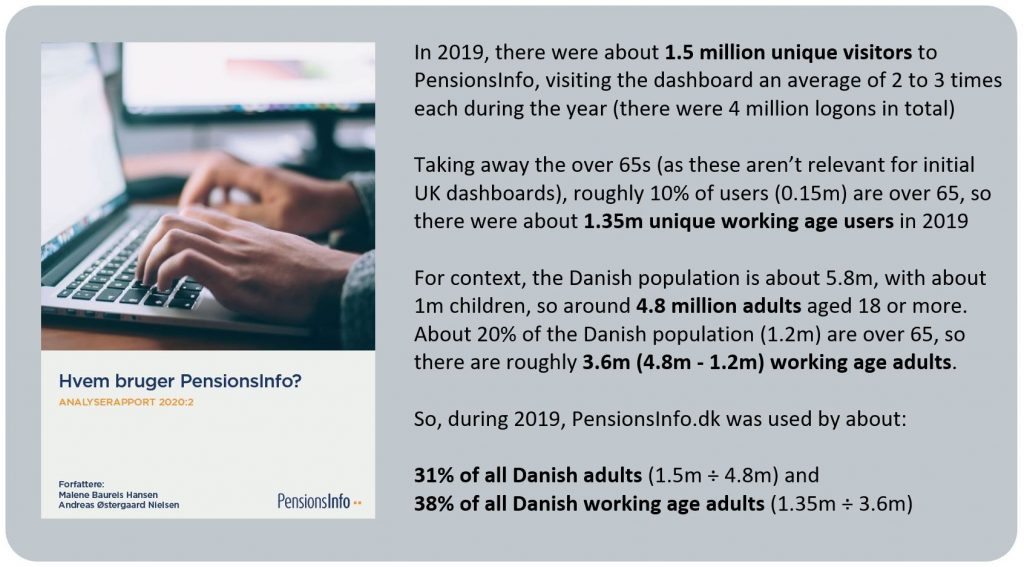
In 2020, the PensionsInfo team produced a detailed analysis report on which types of Danes logged on during 2019 called “Who uses PensionsInfo?” (“Hvem bruger PensionsInfo?”):
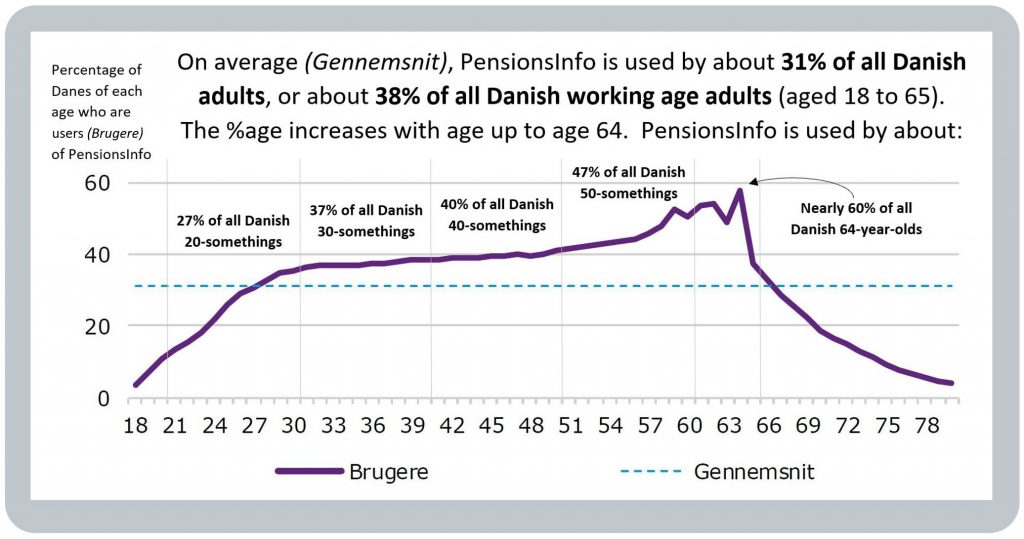
The percentage of the Danish population using the dashboard varies significantly by age, increasing in higher age bands, as shown in the graph below:
Which other segments use PensionsInfo most?
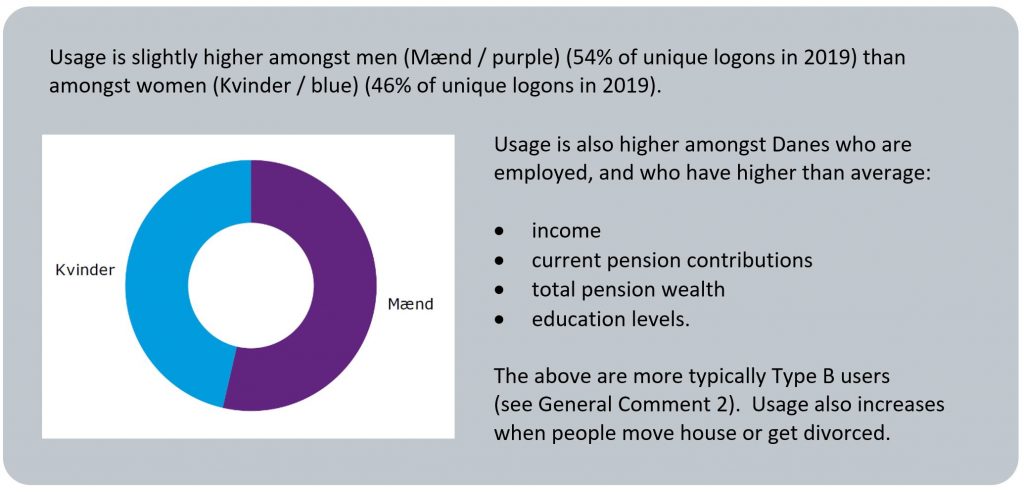
Apart from usage numbers increasing with age, the other segments of the Danish population which use PensionsInfo more are summarised below.
See General Comment 2, about the importance of designing dashboards with layered content so that the service is understandable and helpful for both Type A and Type B users.
Most used features
The PensionsInfo pages / features which are used most often are the:
- main overview page
- “full overview” pension timeline and table of pensions, and
- send data feature.
Usage spikes in January, partly as a result of people re-mortgaging at New Year (remember mortgage lenders in Denmark often need to see your pension information).
Different device usage
Users tend to use laptop / desktop browsers when they are looking at the detailed information on PensionsInfo. People use mobiles when they’re just logging in to send their pension data to a third party.
BLANK
Other information about PensionsInfo
The core purpose of my research tour in June 2023 was to learn more about mature pensions dashboards’ user experiences (UXs) and user interfaces (UIs). However, Michael who leads the Danish team was also very generous providing me with various other insights about the Danish dashboard, which I’ve summarised below.
This “Other information” section covers some summary points on the:
- history of PensionsInfo
- governance of PensionsInfo
- vision for PensionsInfo.
BLANK
History of PensionsInfo
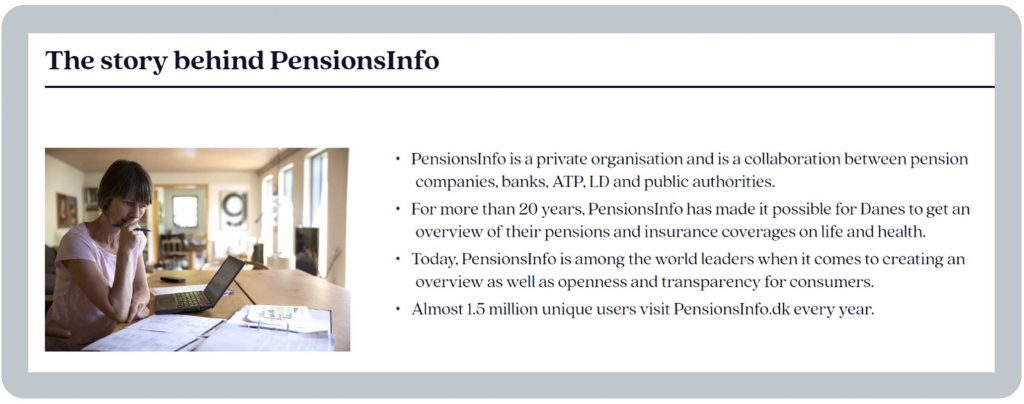
PensionsInfo.dk is the oldest dashboard anywhere in the world, having originally been launched in 1999.
It is run by Forsikring & Pension (F&P) (Insurance & Pension) which, on the About page of their website, is described as “the Danish trade association for insurance companies and pension funds, representing 84 insurance companies and pension funds operating in the Danish market”.
PensionsInfo has been continually developed to maintain its position as a world leader in the provision a total pension overview for its country’s citizens. See more PensionsInfo history on the F&P website.
PensionsInfo’s sophisticated user interface has been achieved incrementally through six or seven major iterations, over its nearly 25 year history, based on continual feedback from users and increasing data capabilities (see Data standards below).
A key principle has been to keep the user interface as simple and understandable as possible. For example, this means layering information and minimising the amount of text on screen for users to read. Michael said:
“It’s so important that you don’t confuse the user – don’t scare them off with long explanations. It’s possible to get an idea of your forecast total pension income without having to understand all the detail”.
More sophisticated users (such as Type B users – see General Comment 2) may be interested in understanding more of the detail about their pensions, hence the importance of layering information, but importantly Michael estimated these Type B users represent no more than 20% of users of PensionsInfo.
Governance of PensionsInfo
PensionsInfo is an independent association of industry pension funds and firms, with operation of the dashboard itself carried out by Insurance & Pension Denmark (Forsikring & Pension (F&P)), which is the Danish equivalent of the UK’s Association of British Insurers (ABI). The PensionsInfo About page also makes clear that the dashboard and association are collaborating with various parts of the Danish Government:
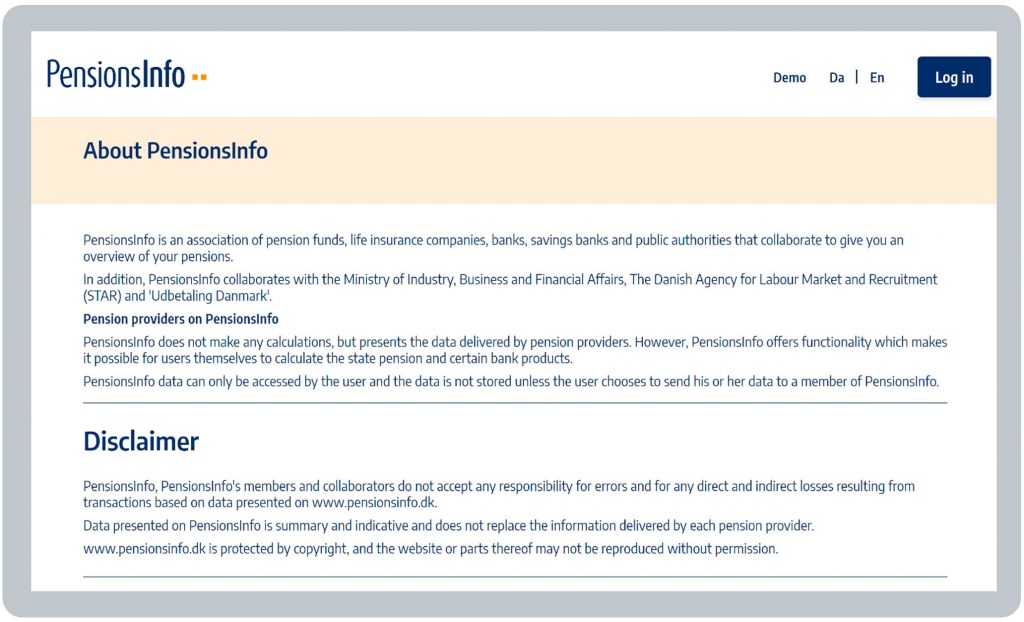
The About page also explains PensionsInfo only shows summary and indicative data and:
- does not replace detailed information from pension providers themselves
- does not accept liability for the summary information shown (as it is supplied by pension providers)
- does not do any calculations on the data supplied by providers, and
- does not store any pension data (although users can download or send on data if they wish).
BLANK
Data standards
There’s been an industry standard basis for pension projections in Denmark since the 1990s, which was last refreshed in 2019. This means that all pension providers calculate projections in the same way.
This enables the timeline of multiple forecasts illustrated above.
A small proportion of pension schemes are not able to return forecast future pension income amounts as described above. For these schemes, contact details are shown on PensionsInfo, so the user can contact them direct (which is seen as much better than not mentioning these schemes at all on the dashboard).
F&P oversee the ongoing governance and maintenance of the standards, and providers’ compliance with them. This flexibility was important in the early days, for example, there was a new data standard in 2007 when banks and commercial life insurers joined PensionsInfo. One practice F&P adopts in the standards is for certain data items to be optional until such time as all pension providers are able to provide them.
Vision for PensionsInfo
F&P’s vision has always been to continually enhance what PensionsInfo does for Danish citizens, in light of feedback from real users. In fact, you can’t get to a sophisticated dashboard until you’ve launched a basic dashboard and heard feedback on it from many real users. In Copenhagen, Michael’s strong advice was to:
“Start small, launch an early version, learn, iterate: don’t try to launch everything at once”.
Crucially, this means accepting that some user needs won’t be met at launch (such as Type B users – see General Comment 2), in order to enable basic functionality to be launched and tested for real.
So even though, over nearly 25 years, PensionsInfo has now become a highly sophisticated service for Danish citizens, it is still being continually developed.
One example of this is PensionsInfo’s already highly developed pension timeline being further improved to graphically show the impact of inflation over retirement.
From September 2023, those pensions which aren’t inflation-proofed are shown actually decreasing over time (see the blue pension in the example below) to represent any “flat” pensions’ reduced spending power in real terms over time. See General Comment 10 for more details on this.
PensionsInfo hasn’t necessarily put pensions “top of mind” for Danes, but what it has done is provide reassurance for Danes. Just through PensionsInfo’s existence, Danish citizens know that, when they want to think about their pensions, there is a place they can see their pensions overview information together, which will support them to make better, more informed decisions than they might otherwise have done.
BLANK
Page content verified by the PensionsInfo.dk team on 13 September 2023