27 August 2026, 9 minute read
It’s the uniqueness of your life that makes pensions adequacy so personal.
My 3-part blog and podcast series illustrates this, using my own story as a case study.
The Second Pensions Commission’s Interim Report analysed adequacy at societal level, but I show how adequacy is highly personal – from your work (Part 1), to your death (Part 2), and through the whole of your life in between (covered in Part 3 below).
This Part 3 blog looks at the same life through 5 lenses:
- the whole of your life (4-Quarter Lives)
- who you are within it (Saver versus Spender)
- how you can see it (MoneyHelper Dashboard)
- what you’ll need in the second half of it (a personalised Retirement Living Standard), and
- what you can do (Thank, Think, maybe Tweak).
I reflect on how seeing your whole life displayed on the pensions dashboard is visceral, and how, over time, people can achieve an ‘adequate’ retirement income.
This blog is for payroll & pensions professionals but read it as the consumer you also are.
Part 3 – Adequacy and life (your whole life)
In lockdown in 2021, I made a pensions dashboard case study video, based on my own story.
The case study deliberately spanned the whole of my life: from The Beatles’ ‘All You Need Is Love’ reaching No 1 on the day I was born in 1967, right through to my death (in the 2050s?).
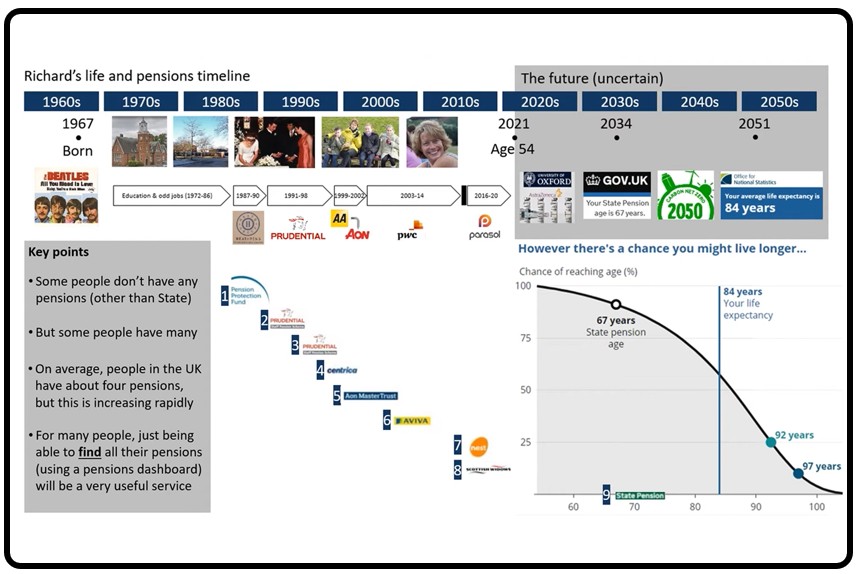
If you measured a 100-year life course in quarters (I know someone who does – read on), then my Q1/Q2 have run, and my Q3/Q4 might run, as follows:
- Q1: 1967-1992 I turned 25 enjoying the Barcelona Olympics, still a single renter
- Q2: 1992-2017 I turned 50 as PM Teresa May lost her majority, a widowed dad of three
- Q3: 2017-2042 I may turn 75, if I make it that far, with kids aged 44, 42 and 40 – eek!
- Q4: 2042-2067 I may turn 100 – will I make it? (dad died just shy of 95, so who knows?)
What has marked out your quarters so far, in the world, and personally, in your life?
How you spend money across the whole of your life
In my timeline above, I showed both the build-up of my different pensions (listed in Part 1 Adequacy and work), and other key elements of my life so far, with a focus on my Q2:
- 1996: got married, aged 28
- 1997: bought our first house together
- 1998-2002: had three children
- 2001: moved to a larger house
- 2004-2013: supported Heather’s ongoing cancer treatment
- 2014: became a widower aged 46 when Heather died (she was 47).
It’s a fairly typical life model (apart from the cancer), with spending choices at all the life stages: choosing to marry, buy a house, have three children, and so on, all cost money.
But the particular spending choices we made over these years were influenced by attitudes formed decades ago in Heather’s and my early years as children – the classic question of whether you grow up a ‘saver’ or a ‘spender’, as I highlighted on LinkedIn for Talk Money Week.
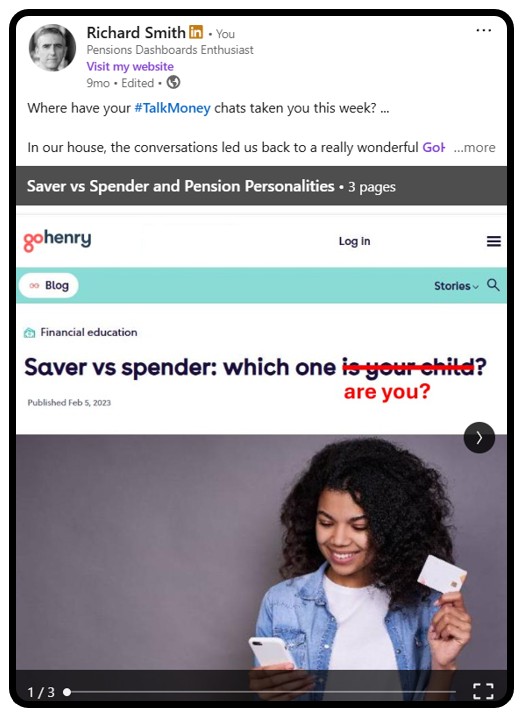
My lifelong ‘saver’ attitude significantly impacted our family spending decisions (balanced with Heather being more of a ‘spender’, which I really miss to be honest).
For example, we didn’t have a huge wedding, the house we bought was less than we could afford, i.e. we didn’t borrow to the max, and we chose inexpensive family holidays in the UK.
This limiting of our expenditure meant we were ‘spreading our consumption’ with more disposable income available to save for the longer term, into things like workplace pensions.
As a single dad, my desire to limit everyday spending has continued (partly out of necessity). For example, in 2018, I gave up flying, and in 2021, I gave up driving, saving me thousands of pounds (not just today, but also in the future when I’m retired – more on this below).
Looking backwards and forwards and your feelings about the future
So, as you live the different quarters of your life, making spending decisions based on deep routed attitudes, how do you easily tell if your lifelong pension saving is going OK?
Well, up to now, that’s been quite a challenge to do.
Which is why, from 2027/28, the UK government is launching a new MoneyHelper Pensions Dashboard (MHPD) online service. Right now, in summer 2026, it’s in live private beta testing. Government hopes to make the MHPD fully publicly available during the 2027/28 financial year.
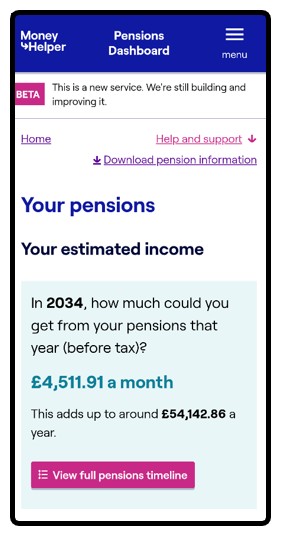
I’ve tested the MHPD myself and, in July, I posted on LinkedIn a screenshot of the main MHPD page showing my own pensions:
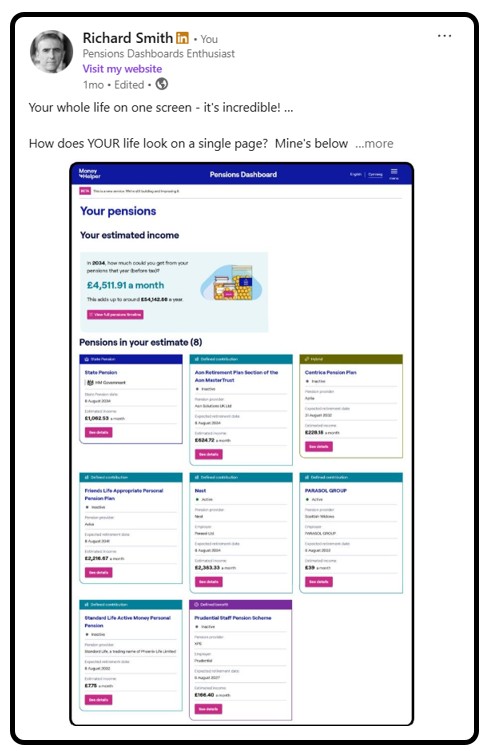
This main page looks both backwards and forwards at the same time, across your whole life:
- Your past: The tiles at the bottom represent each of your different, pensions built up since you started work (in my case, eight tiles / pensions, built up from 1983 to date, covering State, Defined Benefit (DB), Hybrid and Defined Contribution (DC) pensions)
- Your future: At the top, you see the total estimated monthly income you might get from your State Pension age, payable until you die (in my case a gross amount of just over £4,500 a month, payable from 2034, until – as we’ve seen – roughly the 2050s).
That LinkedIn post generated a lot of reaction – there’s clearly great appetite to understand what the MHPD looks like and how it feels to see your whole life of pensions together.
How does it feel?
Former Bank of England Governor Mark Carney once spoke of overcoming the “tragedy of the horizon”. The same idea applies to your future pension income: the MHPD is a time machine.
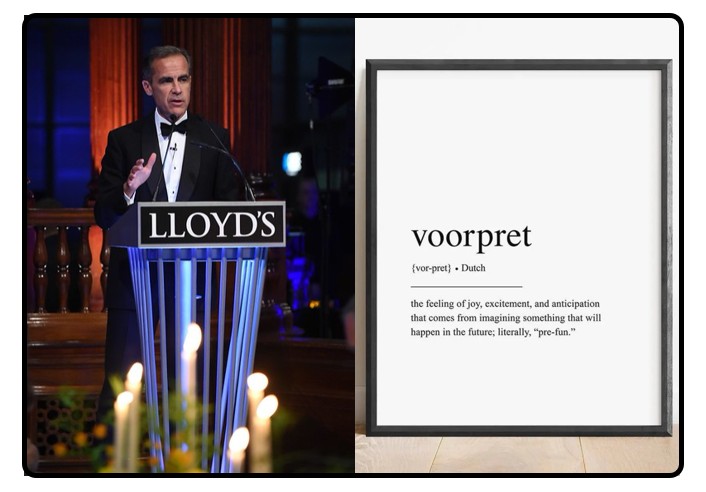
And, once you can easily see your future, you can feel future joy, in advance, for the income you could get from your different pensions: what the Dutch call ‘voorpret’, literally ‘pre-fun’.
Feeling voorpret when you look at the MHPD, knowing you’re going to be OK in later life, means your wellbeing today is enhanced by the future visibility enabled by the dashboard.
Reactions to seeing your total estimated income
What will your visceral reaction be to seeing your total estimated retirement income (ERI)?
For me, my estimated number (just over £4,500 a month from 2034) makes me feel OK(ish).
Only “ish” because, after income tax, that’s about £3,750 a month net (or £45,000 a year net). Or, less if I take tax free cash.
£45,000 a year net is a bit below the RLS* Comfortable level (for a single person household in the London area) – so it’s an OK pension income, but not absolutely fabulous!
(Of course, if you’ve read Part 2 of this series, you’ll know I’m also already receiving a spouses pension of £8,000 a year which, being a pension in payment, isn’t shown on the MHPD. So, in reality, I could achieve the RLS Comfortable level taking that not shown pension into account.)
* The Retirement Living Standards (RLS) from Pensions UK are benchmarks for different levels of spending in retirement – read on for more details.
We know from the Interim Report of The Second Pensions Commission, published in May, that up to 19 million people won’t see a total ERI on the MHPD that they feel is ‘adequate’ for them.
Rather than a joyful feeling of voorpret, they may have a range of other emotional reactions.
This main screen on the MHPD is going to change the UK’s emotional response to pensions.
I confidently predict it will become the most well-known display in the whole of UK pensions (noting that most users of continental dashboards never go beyond this total ERI screen):
3Ts – Thank, Think, maybe Tweak
So, to conclude this discussion, how should government and industry together support people after seeing their whole life of pensions and their total ERI on the MHPD?
Well, as a start, how about this ‘3Ts’ phrase?:
Thank, Think, maybe Tweak.
a) Thank
People should be encouraged to thank themselves for saving for their future selves, and for having the courage to take a look at their ERI.
Yes, the monthly estimated income shown on the dashboard may not be as much as you were hoping for, but at least you now know it and can maybe do something about it.
And, encouragingly, YouGov’s excellent July 2026 research for DWP found retired people with lower pension incomes tend to be “resigned to having a ‘simple’ life looking to the future”.
So don’t panic. This is the most important thing: people definitely mustn’t be turned off pensions, and saving for retirement generally, by their first experience of using the MHPD.
b) Think
Next, think what you might need as an ongoing monthly income in retirement.
Your total ERI shown on the MHPD gives you an ‘anchor’, i.e. how much income might I get?
But then, as Robert Cochran at Scottish Widows famously says, the next question is:
“Is it enough?”
Thinking about ‘enough’, i.e. how much income you might need, is very personal. Everyone’s spending is different – here’s just one example, going back to me giving up driving in 2021.
Pensions UK, the trade body for the UK pension industry, has devised benchmark Retirement Living Standards (RLS) to help people picture their needs for a regular retirement income.
But the RLS are rather blunt and not at all personal, as my not having a car illustrates well.
For a household like mine – i.e. single person, in the London area – RLS estimates annual motoring costs could be between roughly £4,300 (Moderate) and £5,000 (Comfortable) – see the blue highlighted figures in the table below.
That’s four to five thousand pounds, in every year of retirement, which I don’t need.
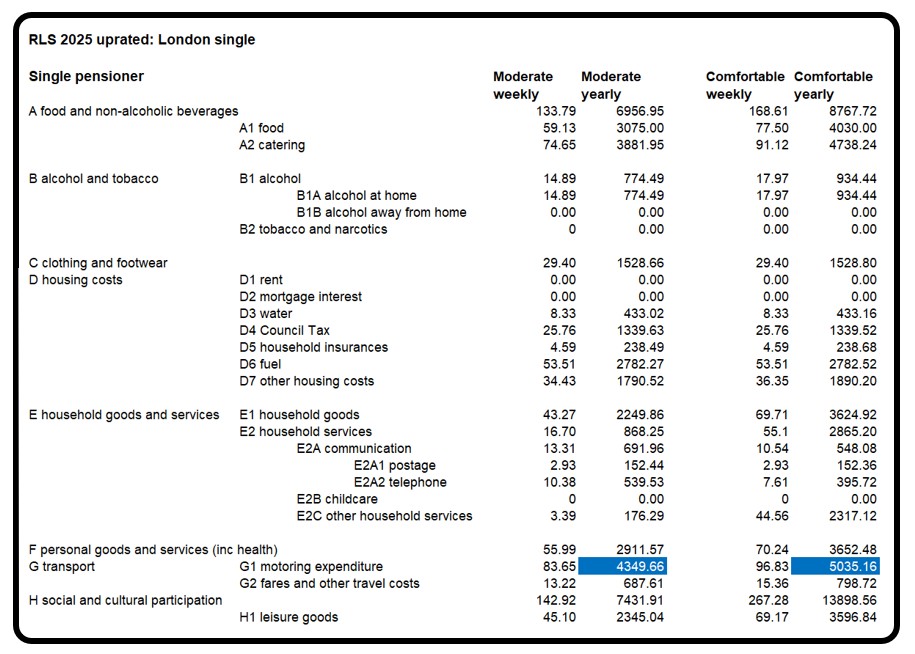
This is just one specific way in which my spending is personal, but each of us is completely different in terms of what we spend our money on (because of what we feel is important).
Alternatively, an Open Banking (OB) categorisation of my current account spending today would immediately tell me how much I spend each month, split between essential and discretionary spend, and (for me) identifying I don’t have any ongoing motoring costs.
c) (maybe) Tweak
Here’s the big one. If your total ERI on the MHPD isn’t as big as you’d like, can you tweak the contributions going in to your active pension? (as I outlined in Part 1 Adequacy and work).
Some common arguments why not:
- “That’s the State’s job” (to look after me if I survive into my 70s, 80s or 90s)
- “I can’t afford it” – I can’t reduce my consumption today to save more for my future
- “I might die” (before I even get to retirement) – like my wife Heather did, dying at age 47.
I discussed these questions with Avivah Wittenberg-Cox on her excellent 4-Quarter Lives podcast.
Yes, the State will look after you if you live in countries like Spain or Greece, where State Pensions replace up to 80% of average earnings.
Look at this graph from the Organisation for Economic Co-operation and Development:
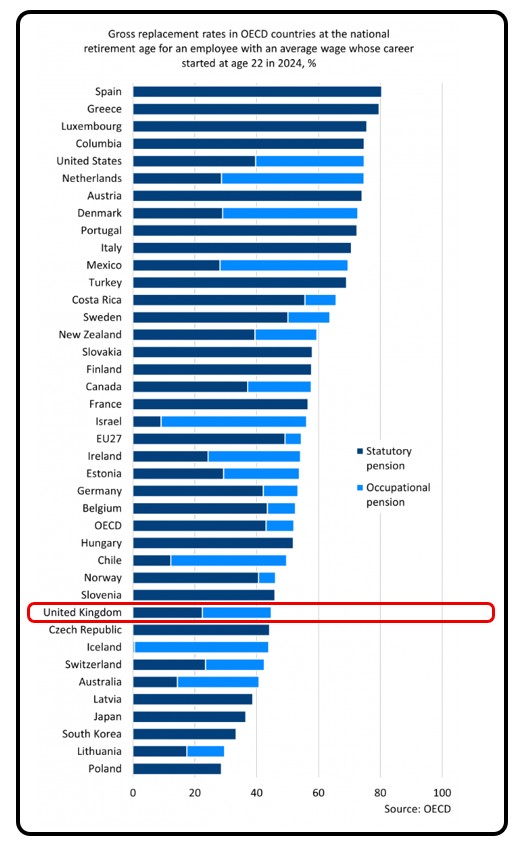
The UK sits near the bottom – our State Pension is designed to replace only a quarter to a third of average earnings, topped up by automatic enrolment into occupational pensions.
Even combined, though, the statutory minimum (light blue bar) only gets an average earner to a total (dark and light blue) of about half their earnings – roughly £20,000 a year gross, or £1,540 a month net.
So if you want an income in retirement which is higher than that, you may need to think about contributing more than the statutory minimum 8% contributions.
“But I can’t afford to contribute more, and I might die early anyway”
This is where it’s up to you. No one except you can move you from being less of a spender and more of a saver. And no one can tell you when you’re going to die.
Speaking with Avivah, I described this as us all having to “make a deal with God” – and, just like the house always wins in a casino, God will always win.
Save too cautiously and you risk under-spending through a life you could have enjoyed; made even worse if you die early in retirement and your pension money outlasts you.
But save too little and you could outlive your money in retirement, potentially spending many impoverished years if you live long into retirement.
We all need to find our way through this conundrum. And I do appreciate, with housing and other costs of living today, it is a much more complex conundrum for Millennials and Gen Zs than it was for me as a Gen X.
For me, one practical answer is to separate out essential spending for which I’ll need a guaranteed, and inflation-proofed, pension income until I die, e.g. for food, energy, council tax, etc.
When I know this income requirement, I can make sure I’m saving enough to cover these costs. Then, at least I know “I’ll be OK” – perhaps going back to that ‘simple retired life’ mentioned in the YouGov research.
If I have pension income left for discretionary spending on top, then that’s a bonus. Plus, I can flex this depending on how things go.
The key thing is to gen up: see your figures on the dashboard, and start thinking about this.
Encouragingly, as I said to Avivah, 2022 research from SEI found that it’s Gen X women who most want to gen up and take control.
And as Avivah said at the end of our chat, this is “not about blame or panic”, but about “honest information, given humanely, with enough support to help people act”.
I call this “giving the UK a great big pensions hug”.
Summary
In combination, the work you do, the person you marry (or don’t marry), and your lifelong attitude to spending and saving, all make pensions adequacy uniquely personal to you.
Seeing your whole life of pensions displayed on the new MoneyHelper Pensions Dashboard generates a visceral feeling – perhaps voorpret, perhaps something else.
Either way, thank yourself for saving, think about what you, personally, might actually need, and, if you can, tweak your contributions.
That’s how you’ll move, gradually, more towards an ‘adequate’ retirement income – delivered partly by the State, and partly by your own pensions.
Thanks so much for reading this 3-part adequacy blog series. If you’d like to discuss it, please do feel free to get in touch.
RS, 27.8.26