The sample dashboard below (Sample012) brings together all the previous discussions from Samples 001 to 011.
Total retirement income built up so far
We know from the extensive 2019 Dutch research users want to see a total estimated income at retirement age built up so far.
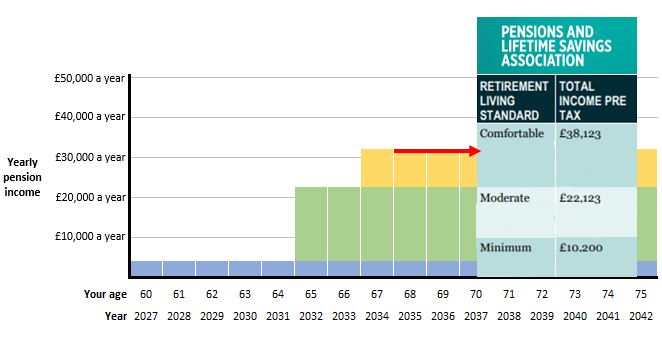
Sample012 suggests a way that dashboards could show this, including:
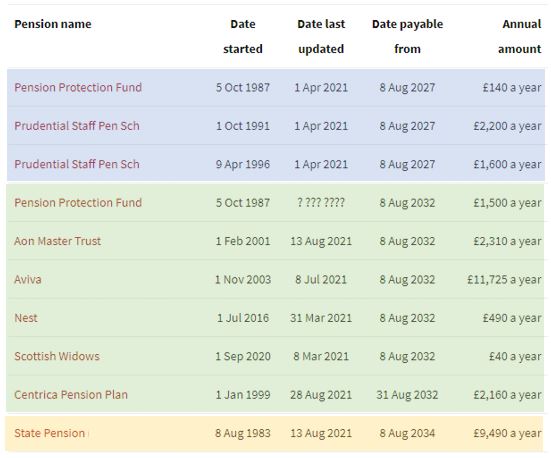
- a graphical timeline showing the year each pension is normally payable
(with a table below for users who don’t warm to the timeline format) - DB pension income amounts accrued / revalued to date, i.e. as at now
- DC pension income amounts built up so far (3½ per cent of current DC fund values).
Because all the pensions are as at now, they’re sufficiently comparable to be stacked on each other in the timeline, and compared against the PLSA Retirement Living Standards.
This enables the user to see how they are getting on so far in terms of building up a minimum, moderate or comfortable income in retirement.
In my example below, the red arrow shows that I’m about 60% of the way from moderate to comfortable.
If I wish to aspire to the £38,123 a year comfortable target, I have 13 years between now and my State Pension Age in 2034 to pay in more contributions to grow my income towards £38,000 a year from age 67.
Remaining discussion topics are covered below the dashboard.
Sample012
Discussion topics
All the suggested ideas in these dozen dashboards need to be thoroughly tested with users. The specific topics to be tested are covered in the discussions under each dashboard.
There are some further complexities which we haven’t yet touched on, though. Of course, these topics all need to be tested with users too:
1) Missing pension income amounts
There will always be some schemes and providers where it just isn’t possible to return a pension income amount for the user to view on their chosen dashboard. This could be because of very special complex circumstances, or other reasons.
There will need to be a way of clearly flagging this to the user on a dashboard, so they are fully aware there is more pension available to them that they’re not seeing. They will need to be clearly directed to the relevant scheme or provider to find out more details.
2) Separate cash lump sums
My sample dashboards completely ignore the option of taking some of your pension as a tax free cash lump sum. This is too complex to cover in initial dashboards and will need to be discussed between the individual and their specific schemes / providers when they come to access their pensions.
Some schemes, however, have separately accruing cash lump sums, i.e. not an option but a separate benefit under the scheme rules. I don’t have any schemes like this so I haven’t been able to illustrate it in my sample dashboards.
I think this situation could be the one exception where a cash lump sum could be shown on a dashboard. If the timeline format is used, the separate lump sum could be shown as a one year payment.
This is very similar to how the Danish dashboard deals with this situation. In the example screenshot below, the brown bar represents is a one off cash lump sum payment, i.e. not a recurring income like the blue, green and grey bars:

3) Income Tax
All the pension income amounts shown are before income tax, i.e. gross pension incomes.
This is why, on the Sample012 timeline above, I have compared my pensions against the “Pre Tax” Retirement Living Standards (i.e. £10k, £22k, £38k). The more widely publicised, and simpler £10k, £20k, £30k RLSs relating to income after tax, i.e. net pension incomes.
It will be too difficult for initial dashboards to get involved with tax calculations. But we know from the Dutch research that what users really want to see is a total estimated monthly retirement income net of tax.
So users will need to be clearly made aware that the figures they are seeing will have income tax deducted, as applicable.
4) Pensions payable on death
My sample dashboards focus on pension incomes payable to me, but they ignore what pension incomes (or other payments such as lump sums) would be payable to my spouse, partner, children, other dependents after my death.
Again it will be far too difficult for initial dashboards to show death benefits. But users will need to understand that these important benefits exist, and should be encouraged to liaise with their schemes / providers to find out more about what these amounts would be.
Next steps
Thanks ever so much for persevering right to the end 🙂 I’m really looking forward to discussing all these ideas with policy, regulator and industry colleagues as the alpha and beta testing phases really start getting underway from late 2021 and into 2022.
Cheers, Richard.